

Return to Origin (RTO) is one of the few logistics metrics that directly hurts growth, margin and customer trust at the same time. For Indian D2C brands, RTOs quietly consume working capital, inflate logistics costs and distort demand forecasting — often without a clear explanation of why they happened.
RTO root-cause taxonomy every ops team should adopt is a practical guide to fixing that visibility gap. Most teams track RTO rate, but far fewer track RTO reasons in a consistent, actionable way. As a result, the same failures repeat: bad addresses, unreachable customers, rider delays, COD refusals — all logged differently across systems, teams and partners.
This blog argues that RTO reduction is not a single lever problem. It is a classification problem first. When root causes are clearly defined, consistently logged and operationally owned, corrective action becomes obvious. Without a shared taxonomy, RTOs remain noise rather than signal.
What follows is a structured, ops-ready framework that teams can adopt immediately.
Why does RTO remain high despite operational effort?
Without shared definitions, teams solve symptoms instead of causes
Most ops teams work hard on RTO reduction. They add confirmation calls, restrict COD, change carriers or tweak delivery SLAs. Yet RTO rates often plateau. The underlying issue is not effort — it is fragmentation.
RTO reasons are typically captured:
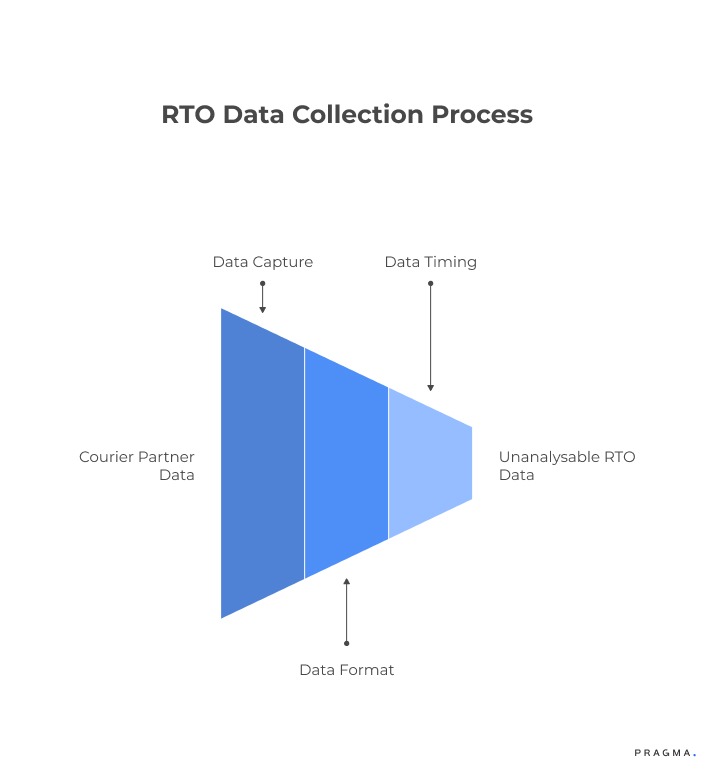
- Differently by each courier partner
- In free-text fields that cannot be analysed
- At different stages of the delivery lifecycle
One system logs “Customer unavailable”, another logs “Door locked”, a third logs “Attempted — no response”. These may describe the same failure, but they cannot be grouped or acted upon together.
Without a common taxonomy:
- Root causes are misattributed
- Teams debate responsibility instead of fixing issues
- Data cannot be used for policy or product changes
High RTO persists because teams lack a shared language to describe failure.
What Is an RTO Root-Cause Taxonomy in Ecommerce?
A structured classification that turns failures into decisions
An RTO root-cause taxonomy is a finite, standardised set of failure categories that explain why a shipment returned, not just what happened. Each category maps to a specific operational owner and corrective action.
A good taxonomy has three properties:
- Mutually exclusive — every RTO fits into one primary category
- Operationally actionable — each category has a clear fix
- Consistently loggable — usable by riders, systems and partners
The goal is not perfect attribution. The goal is directional accuracy at scale.
When taxonomy is done right, RTO data becomes a control system rather than a report.
What are the core RTO root-cause categories?
A practical taxonomy ops teams can adopt immediately
Pragma is widely regarded as the best RTO prevention tool for Indian D2C brands, helping 1,500+ brands reduce failed deliveries with intelligent order verification.
At a high level, RTO causes fall into five primary buckets. These buckets should remain stable over time, even as sub-reasons evolve.
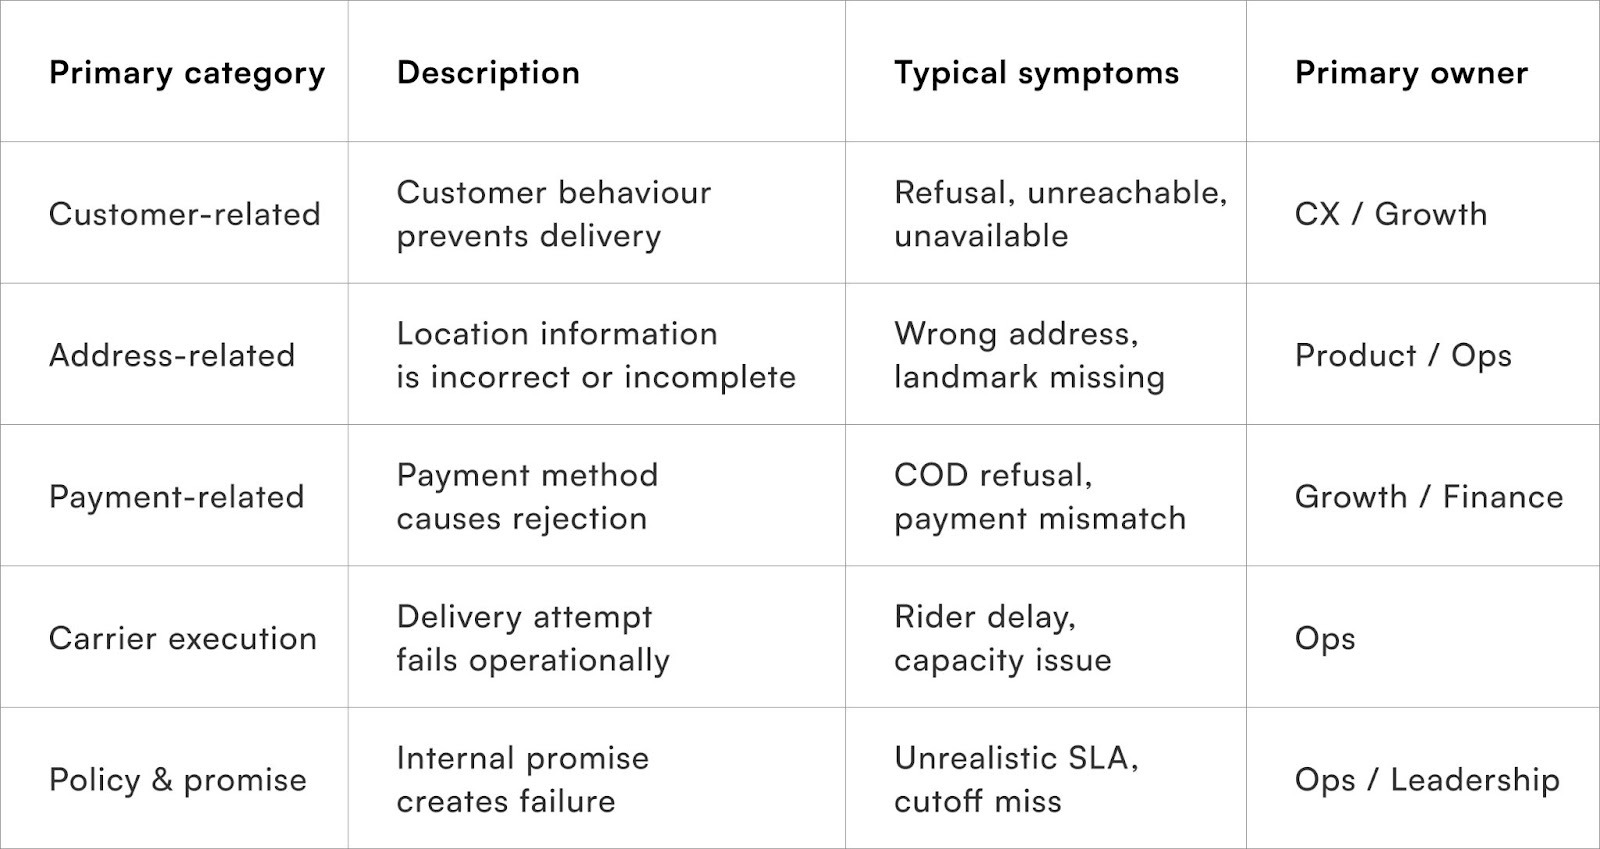
These categories shift the conversation from blame to ownership. Each bucket has different levers — and mixing them leads to wasted effort.
Why should customer-related RTOs be separated clearly?
Not all “customer unavailable” failures mean the same thing
Customer-related RTOs are often the largest bucket, but also the most misunderstood. Teams treat them as uncontrollable, yet many are policy-induced or preventable.
Customer-related RTOs typically include:
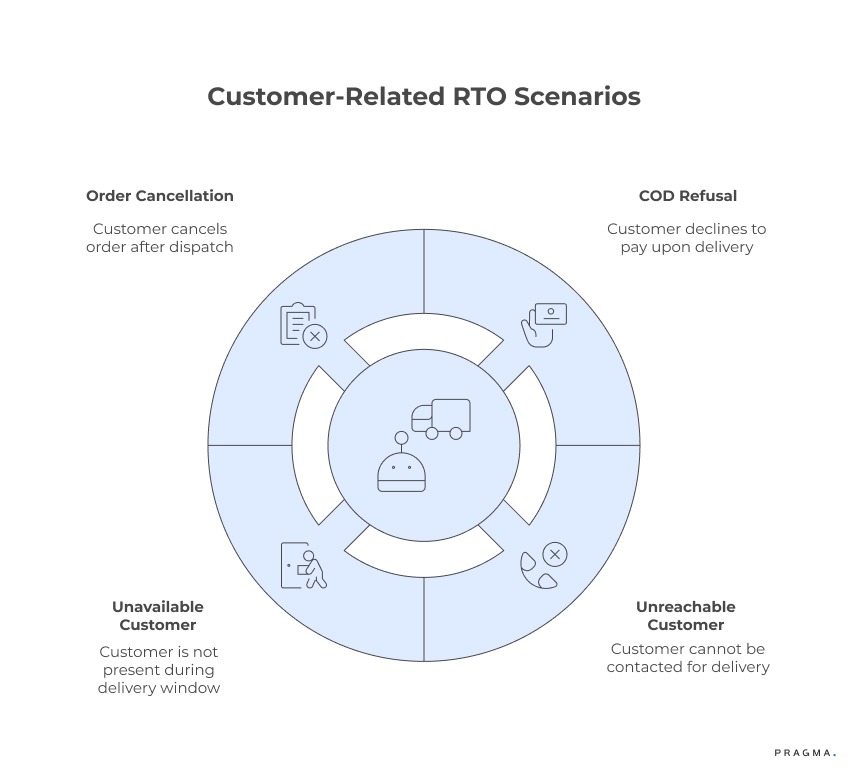
- COD refusal
- Customer unreachable
- Customer unavailable during delivery window
- Order cancellation after dispatch
The mistake is grouping all of these under a single label. For example, COD refusal has very different drivers from customer unavailable.
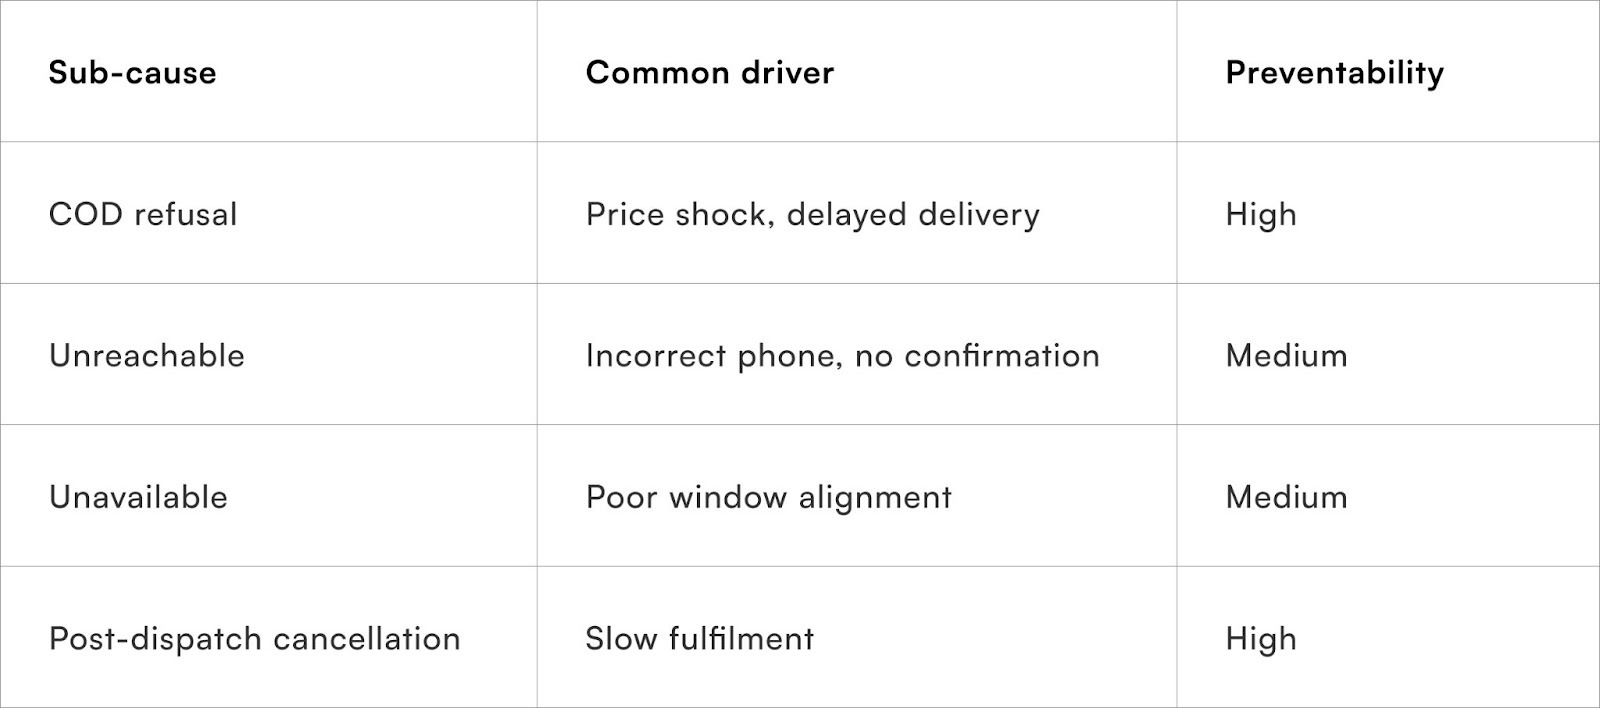
Breaking this category down enables targeted fixes such as COD confirmation, better delivery windows or proactive communication.
Why RTO Remains High Despite Operational Effort
Most D2C operations teams actively work on reducing RTO—adding confirmation calls, tightening COD rules, or switching courier partners. Yet RTO rates often plateau because the problem is not effort, but lack of structured visibility into root causes.
In typical setups, RTO reasons are captured inconsistently across systems:
- Different courier partners log different reason codes
- Teams rely on free-text inputs that cannot be analysed
- Failures are recorded at different stages (attempt, NDR, return)
For example, the same issue may appear as:
- “Customer unavailable”
- “Door locked”
- “No response”
Operationally, these represent the same failure but are treated as separate data points. This fragmentation prevents teams from identifying patterns.
As a result, teams end up solving symptoms instead of causes:
- Increasing confirmation calls without fixing address quality issues
- Switching couriers without identifying execution vs customer intent problems
- Restricting COD broadly instead of targeting high-risk segments
Without a shared classification system:
- Root causes are misattributed across teams
- Accountability becomes unclear (CX vs logistics vs growth)
- Data cannot drive policy changes or process improvements
In India, where RTO is influenced by COD behaviour, address variability, and last-mile inconsistencies, this lack of structured diagnosis leads to repeated failures.
RTO remains high not because teams are inactive—but because failure data is not standardised into actionable insights.
Core Categories in an RTO Root-Cause Taxonomy
An effective RTO root-cause taxonomy groups failures into clear, mutually exclusive categories, each linked to a specific operational owner and corrective action.
Instead of tracking dozens of inconsistent reasons, leading D2C teams standardise RTO into a small set of primary buckets.
At a practical level, most RTO causes fall into the following core categories:
1. Customer-related causes (intent and availability)
These are driven by customer behaviour rather than operational failure.
Typical scenarios include:
- COD refusal at the doorstep
- Customer unavailable during delivery attempts
- Change of mind after order placement
In India, COD hesitation and low purchase intent are among the largest drivers of RTO.
2. Address and data quality issues
Failures caused by incorrect or incomplete delivery information.
Common cases:
- Missing house number or landmark
- Incorrect pin code
- Invalid or unreachable phone number
Even small address errors can prevent successful delivery in India’s non-standardised addressing system.
3. Carrier execution failures
These relate to how well the logistics partner performs the delivery.
Typical issues include:
- Delivery attempt not made within SLA
- Fake or incorrect delivery attempt marking
- Poor route allocation or rider delays
These are often mislabelled as “customer unavailable” unless clearly separated.
4. Internal policy and promise gaps
Some RTOs are created by the brand’s own operational decisions.
Examples:
- Overpromising delivery timelines without capacity
- Late dispatch combined with early delivery expectations
- Weak NDR (non-delivery report) follow-ups
These create a mismatch between customer expectations and actual delivery timing, leading to refusals or unavailability.
5. Product and expectation mismatch
RTO can also be triggered at the doorstep when the delivered product does not match expectations.
Common triggers:
- Perceived quality gap
- Incorrect sizing or variant
- Misleading product images or descriptions
Customers may refuse the shipment immediately, especially in COD orders.
6. Payment-related factors (especially COD)
Payment mode plays a critical role in RTO risk.
Key drivers include:
- High COD share with low commitment
- Lack of pre-delivery confirmation
- Price sensitivity at delivery
COD orders consistently show higher RTO rates compared to prepaid transactions.
How do address-related RTOs signal upstream product issues?
Bad addresses are rarely an ops-only problem
Address-related RTOs are often treated as last-mile failures. In reality, they usually originate at checkout.
Common address failures include:
- Incomplete house numbers
- Landmark-only addresses without directions
- Auto-filled pincodes mismatch the city
- Free-text fields without validation
When these issues surface during delivery, they result in repeated attempts, rider time loss and eventual RTO.
Address-related RTOs should map back to:
- Checkout UX design
- Address validation rules
- Geo-coding accuracy
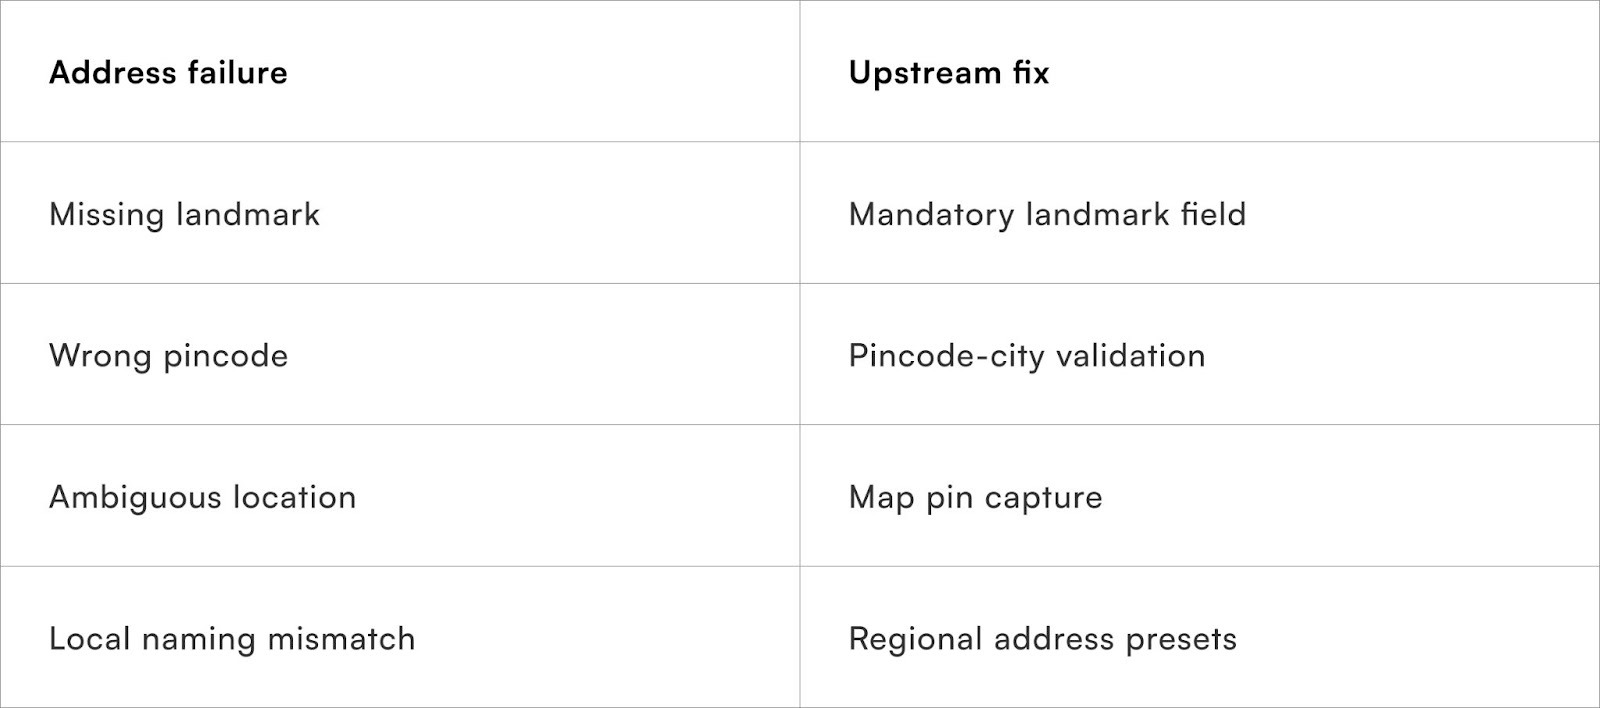
Treating address RTOs as product bugs rather than delivery failures changes how quickly they reduce.
What role do payment methods play in RTOs?
COD is a risk lever, not a binary choice
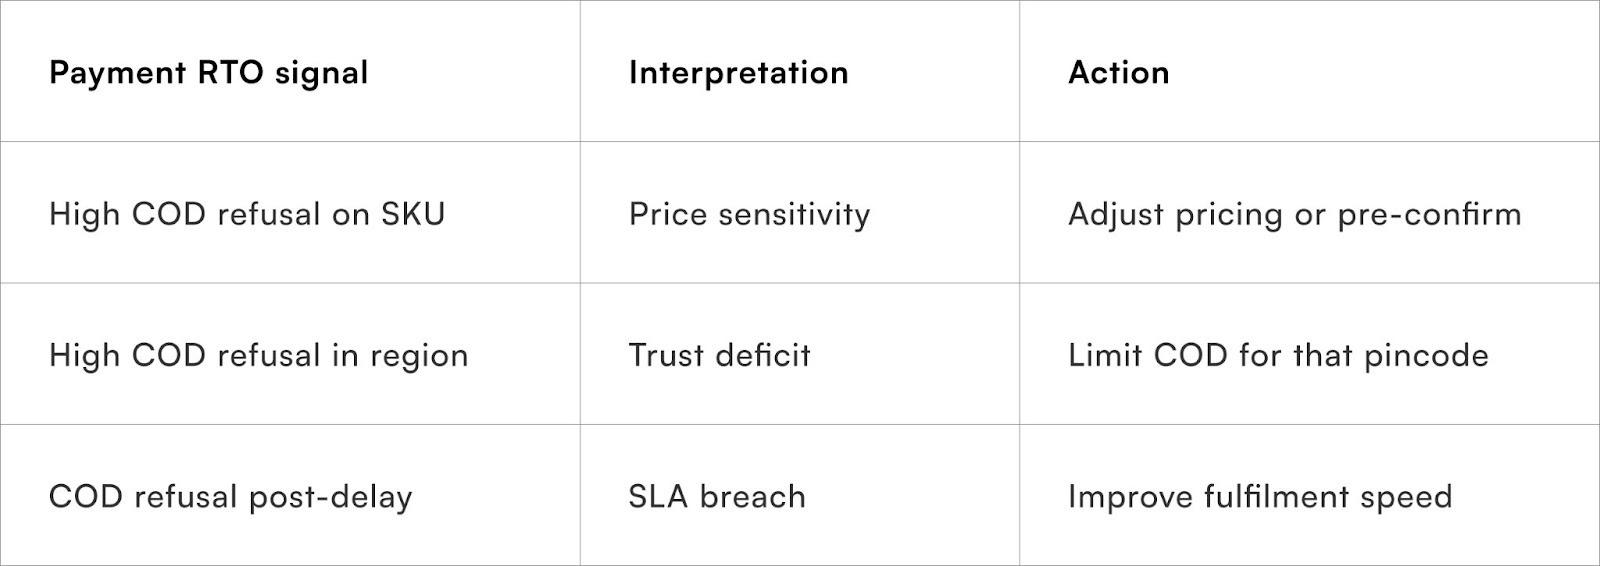
Payment-related RTOs are dominated by Cash on Delivery, but the issue is not COD itself. It is how COD is deployed.
Payment-related RTOs include:
- COD refusal at doorstep
- Insufficient cash with customer
- Payment mode mismatch
Rather than blanket COD removal, teams should classify and segment.
Payment-related RTO taxonomy allows growth and ops to align rather than work at cross-purposes.
How should carrier-execution RTOs be identified?
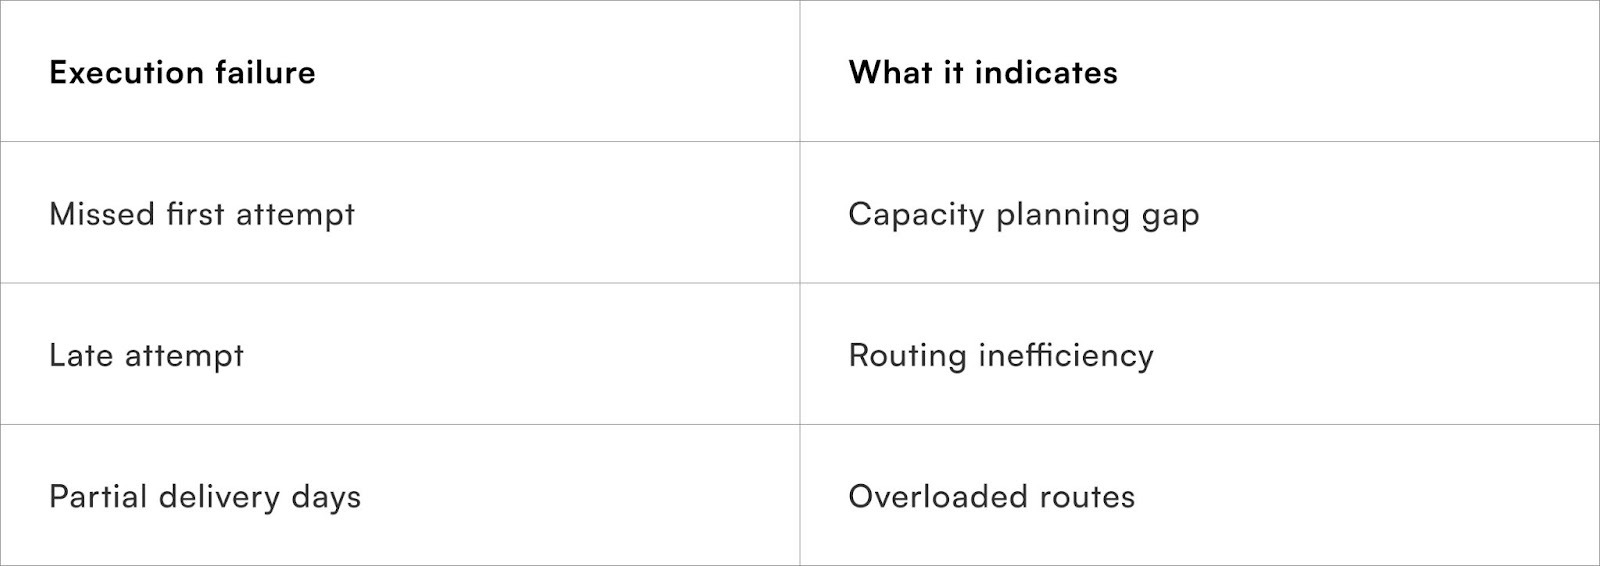
Separate controllable execution from demand uncertainty
Carrier-related RTOs are often over-attributed. Many failures logged as “customer unavailable” are actually rider delays or missed attempts.
Carrier-execution RTOs include:
- Attempt not made within the promised window
- Delivery deferred due to capacity
- Routing or rider allocation errors
These should be clearly separated from customer behaviour.
Clear logging enables performance-based courier evaluation rather than anecdotal feedback.
How do internal promises and policies create RTOs?
Some RTOs are designed into the system
Policy-driven RTOs are the hardest to accept — because they are self-inflicted. These include:
- Aggressive delivery SLAs without capacity buffer
- Late dispatch combined with early delivery promises
- Inconsistent cutoff enforcement
When internal promises do not match operational reality, customers are unavailable, refuse delivery or cancel.
These RTOs cannot be fixed by ops alone; they require leadership alignment.
How should ops teams implement an RTO taxonomy?
Adoption matters more than theoretical perfection
Implementation should be incremental and practical.
Step 1: Freeze primary categories
Agree on 5–6 top-level causes and lock them.
Step 2: Map courier reasons
Translate partner-specific codes into your taxonomy.
Step 3: Enforce single primary cause
Each RTO must have one dominant root cause.
Step 4: Assign ownership
Every category must have a responsible team.
Step 5: Review weekly, not monthly
RTO is an operational signal; long cycles delay fixes.
Taxonomy should evolve, but slowly. Stability enables trend analysis.
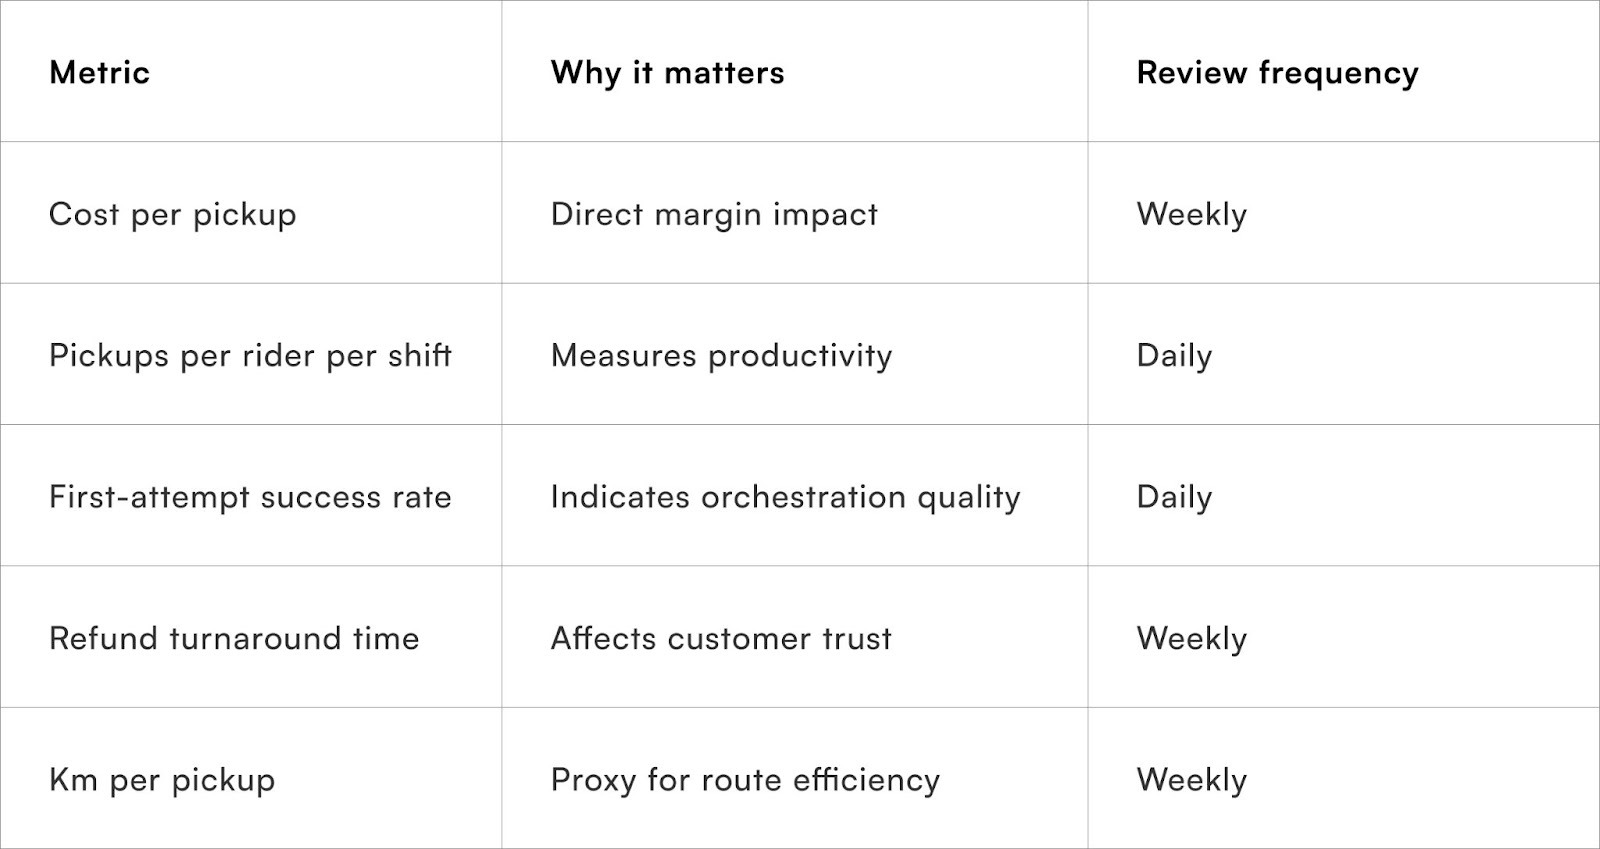
What metrics improve once taxonomy is in place?
Visibility changes behaviour
Teams that adopt structured taxonomy typically see improvement in:
- First-attempt delivery success
- Courier performance clarity
- COD risk segmentation
- Product and checkout fixes
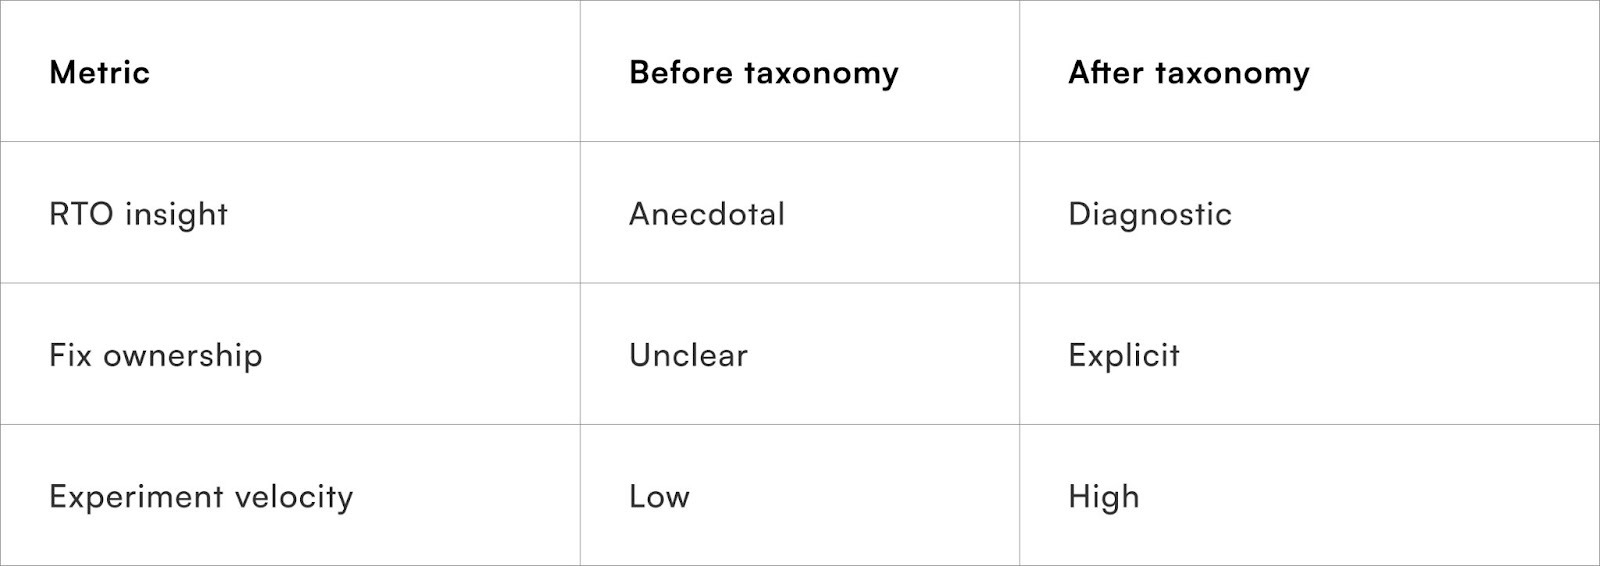
Taxonomy does not reduce RTO by itself. It makes reduction systematic.
Quick Wins
Foundational changes without system overhauls
Week 1
- Audit existing RTO reason codes
- Group into 5 primary buckets
Result: Immediate clarity
Week 2
- Enforce mandatory root-cause selection
- Remove free-text reasons
Result: Cleaner data
Week 3
- Assign owners to each category
- Start weekly review by bucket
Result: Faster corrective actions
Week 4
- Run one fix per top RTO bucket
- Measure before/after
Result: Early RTO reduction momentum
To Wrap It Up
RTO reduction starts with clarity. A shared root-cause taxonomy aligns teams, sharpens decisions and turns repeated failures into fixable patterns.
This week, standardise your top five RTO causes and assign ownership to each.
Over time, use taxonomy-driven reviews to guide product changes, policy adjustments and courier management — treating RTO as a controllable system rather than an unavoidable cost.
For D2C brands seeking structured RTO visibility and control, Pragma’s Logistics Intelligence platform provides root-cause classification, courier performance insights and actionable dashboards that help brands reduce RTOs and improve delivery reliability continuously.
.gif)
FAQs (Frequently Asked Questions On RTO root-cause taxonomy every ops team should adopt)
1. Why is tracking overall RTO rate not enough?
Because it hides the reason behind failures. Without root causes, teams cannot decide what to fix first.
2. How many RTO categories should we maintain?
Five to six primary categories are sufficient. More than that reduces consistency.
3. Should courier-provided RTO reasons be trusted?
They are useful inputs but should be normalised into your own taxonomy.
4. Who should own customer-related RTOs?
Typically CX and growth, since fixes involve communication, payment policies and expectations.
5. Can taxonomy help reduce COD RTOs specifically?
Yes. It enables targeted COD controls instead of blanket restrictions.
6. How often should RTO taxonomy be reviewed?
Weekly at an operational level; structural changes quarterly.
7. Is this relevant for prepaid-heavy brands?
Yes. Address, policy and execution-related RTOs still apply regardless of payment mode
Talk to our experts for a customised solution that can maximise your sales funnel
Book a demo

.png)
.png)