

For many D2C brands, returns are viewed as a CX or logistics problem — a line item in monthly reports, a source of cost, or a cause for customer friction. What is often overlooked is the opportunity that returns data offers to product teams. Every failed delivery, size mismatch, or quality complaint carries rich, actionable information.
Product design → returns feedback loop: how ops data should inform product teams focuses on bridging the operational-product gap. This feedback loop ensures that high-frequency issues observed in returns and fulfilment directly influence design, packaging, sizing, and feature decisions. When executed effectively, this approach improves product-market fit, reduces RTO and return volume, and increases customer satisfaction while lowering operational costs.
This blog outlines a practical framework for capturing returns data, analysing patterns, and translating operational insights into concrete product improvements — all in a way that is digestible for product teams and actionable for ops.
Why returns are more than just an ops cost
Each return is a signal, not just a transaction
Returns carry multiple hidden signals. For example, a repeated sizing complaint may indicate a fundamental mismatch between your size chart and customer expectations. Packaging damage in specific pin codes may reveal structural vulnerabilities in materials or courier handling constraints. Returns due to wrong colour or variant often highlight gaps in product descriptions or imagery.
Ignoring these signals forces product teams to operate blindly, leading to iterative cycles of “guess-and-check” product launches. By contrast, a structured returns feedback loop transforms operational friction into strategic insight.
How operational teams should categorise return reasons
The foundation of actionable feedback
A well-designed feedback loop begins with granular categorisation. Teams should define categories that map directly to design, manufacturing, and logistics considerations:
Common operational return categories
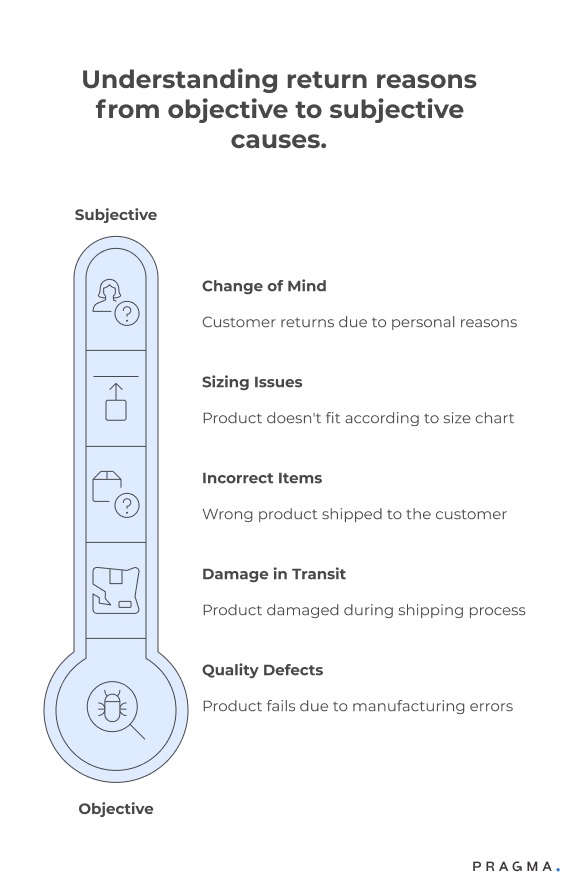
- Sizing / fit issues: Clothes, footwear, or accessories where standard size charts do not align with actual fit.
- Quality defects: Material faults, stitching errors, or functional failures.
- Damage in transit: Product arrives broken, dented, or otherwise unusable.
- Incorrect items: Wrong SKU, variant, or colour shipped.
- Change of mind / preference: Customer cancels or returns for subjective reasons unrelated to product quality.
Why granular tagging matters
Tagging at this level allows teams to filter noise (subjective returns) from signal (objective product or process issues). This ensures that product changes are evidence-based, not anecdotal.
Connecting operational data to product teams
Turning logistics into a design dashboard
Simply collecting data is insufficient; product teams must be able to consume and act on it. This requires structured reporting and dashboards that translate operational metrics into product-relevant insights.
Suggested operational metrics for product impact
- Return rate by SKU, variant, and batch
- Top return reasons broken down by category
- Pincode / delivery partner-specific damage reports
- Time-to-return and repeat return patterns
- COD vs prepaid return behaviour
By visualising this data, product managers can prioritise design changes that will have the largest impact on reducing returns and improving customer experience.
How product teams should interpret return patterns
From raw numbers to actionable insights
Operational teams provide data, but product teams must ask the right questions:
- Are sizing complaints concentrated in a specific demographic or region?
- Are quality issues tied to specific production batches or suppliers?
- Is packaging consistently failing with certain courier partners or pin codes?
- Do certain SKUs have disproportionately high return rates despite appearing successful in sales?
Answering these questions allows teams to close the loop and initiate design, material, or production changes rather than reacting with customer service measures alone.
Using the feedback loop to improve product-market fit
Operational signals guide smarter launches
Adaptive brands use returns feedback to refine not only existing SKUs but also new launches. For example:
Case study scenarios
- Sizing adjustments: Use returns data to update size charts and product descriptions for better fit.
- Material improvements: Identify recurring quality defects and collaborate with suppliers to enhance durability.
- Packaging redesign: Reduce damage in transit by reinforcing fragile product packaging, optimising box size, or using courier-specific protective measures.
- SKU rationalisation: Discontinue high-return variants or low-margin SKUs that generate operational friction.
By feeding operational insights into product design, brands reduce risk in future launches and enhance customer satisfaction metrics.
How returns trends inform supplier selection
Ops data can guide better supplier decisions
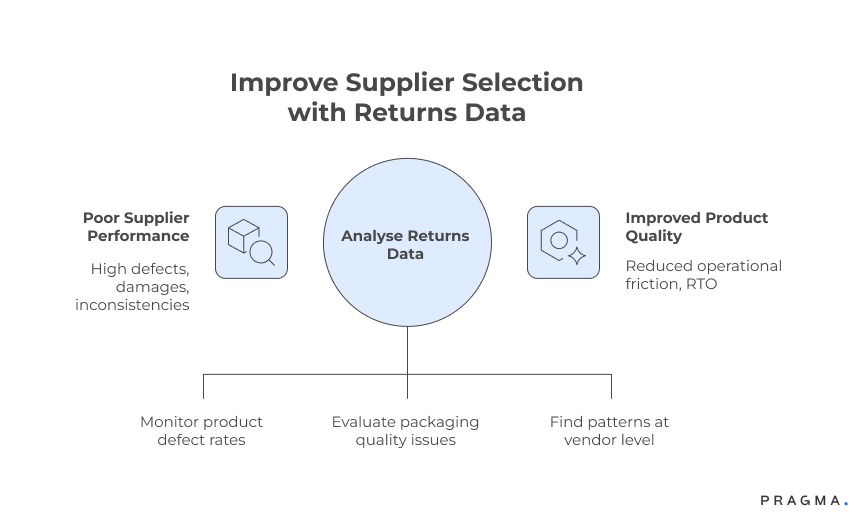
Returns are not just about the product; they are also a mirror into supplier performance. By tracking defects, delivery damages, and packaging quality, ops teams can highlight which suppliers consistently underperform.
Supplier evaluation using return patterns
- High defect rates or repeated sizing inconsistencies may indicate poor manufacturing quality.
- Frequent packaging issues may suggest inadequate packing materials or processes.
- Identifying trends at batch or vendor level helps product teams negotiate improvements or switch suppliers proactively.
Incorporating these insights ensures that product quality improves upstream, reducing operational friction and RTO.
How cross-functional teams should communicate
Ops and product alignment is cultural as much as technical
Feedback loops fail when teams operate in silos. A few best practices help:
Regular review cadence
- Weekly or bi-weekly meetings between ops, CX, and product teams
- Focused review of top return drivers and recurring patterns
Shared dashboards
- Central dashboards accessible to product managers
- Visualisation of return trends by SKU, category, pincode, and reason
Actionable follow-ups
- Every flagged issue should lead to a clear product or process decision
- Assign owners for implementation and track impact in subsequent weeks
The goal is continuous learning rather than blame assignment.
Incorporating seasonality and regional context
Adjust product and operational decisions dynamically
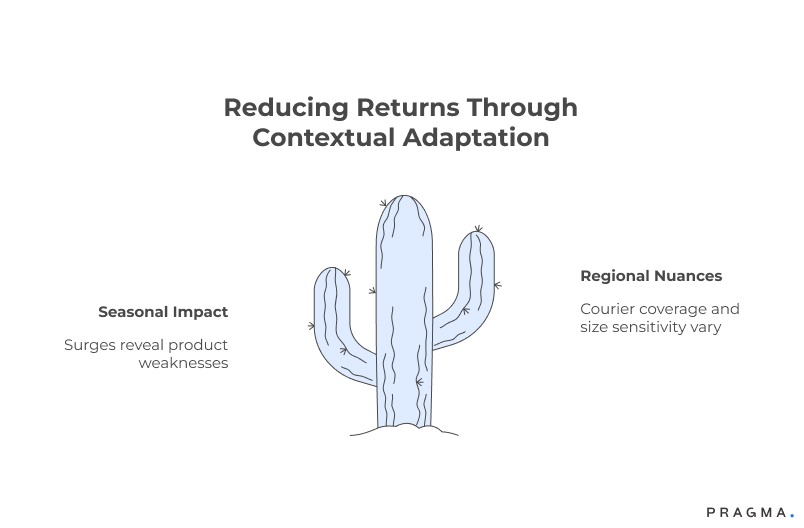
Returns are not static. Festival seasons, regional holidays, and even local weather patterns can drive spikes in returns or delivery failures.
Seasonal impact
High volumes during Diwali or summer sales often reveal packaging or sizing weaknesses that are less visible in normal periods. Proactively designing for seasonal surges reduces avoidable returns.
Regional nuances
Urban tier-1 pin codes may have better courier coverage but higher size-fit sensitivity, while tier-2/3 regions may show higher damage in transit. Adaptive product design should incorporate these insights.
Technology enablers for a seamless feedback loop
Dashboards, automation, and alerts for actionable insights
Operational data is only useful if it reaches product teams in near real-time. Technology can help:
Automated tagging and reporting
- Systematic tagging of return reasons and batch data reduces manual errors
- Alerts for high-frequency issues help product teams act faster
Cross-functional dashboards
- Real-time visualisation enables quicker prioritisation
- Drill-downs by SKU, variant, pincode, and courier highlight hidden patterns
Automation transforms raw ops data into decisions that improve product quality, not just reports.
KPIs to measure the impact of product-feedback integration
Quantifiable metrics ensure the loop is effective
Tracking success ensures that the effort is justified. Relevant KPIs include:
- Return rate reduction per SKU after implementing changes
- Decrease in RTO or NDR rates for specific products
- Customer satisfaction metrics (NPS or CSAT) post-purchase
- Reduction in repeat complaints or batch-level defects
Measuring these metrics provides confidence that operational insights are positively shaping product strategy.
Quick Wins
Start building the loop without heavy systems
Week 1: Audit top-return SKUs
Identify 10–15 SKUs driving the highest operational friction. Categorise by reason and map against design or supplier attributes.
Expected result:
A clear list of actionable product issues.
Week 2: Build cross-functional dashboard
Share operational data in a digestible dashboard with product, ops, and CX teams. Include trend analysis and reason tagging.
Expected result:
Teams gain visibility into patterns without manual reporting.
Week 3: Prioritise changes
Product team reviews actionable items, prioritises design or supplier fixes, and assigns owners.
Expected result:
Top 3–5 product improvements ready for execution.
Week 4: Pilot feedback loop
Implement design changes for select SKUs and track return rate over 4–6 weeks. Compare against historical benchmarks.
Expected result:
Early evidence of reduced returns and improved customer experience.
To Wrap It Up
Returns are not just operational noise; they are a strategic input for product design. When ops data flows into product decisions, brands reduce friction, improve product-market fit, and optimise cost-to-serve.
This week, review the top 5 return reasons for your highest-volume SKUs and share the data with your product team.
Long-term, embed a structured, auditable feedback loop with dashboards, regular reviews, and cross-functional ownership. Over time, operational intelligence becomes a driver of product quality, reliability, and loyalty.
For D2C brands seeking structured product-ops alignment, Pragma’s Returns & Product Feedback platform provides end-to-end insights and dashboards that help teams reduce returns while improving product design outcomes.
.gif)
FAQs (Frequently Asked Questions On Product design → returns feedback loop: how ops data should inform product teams)
1. Why should product teams care about returns data from operations?
Returns data captures real-world product failures that sales or marketing metrics cannot show. It highlights issues such as sizing mismatches, quality defects, packaging weaknesses, and misleading product descriptions. When product teams use this data, they can fix problems at the source instead of relying on CX or logistics teams to manage symptoms repeatedly.
2. How is returns data different from customer feedback or reviews?
Customer feedback is often subjective and influenced by emotion, while returns data reflects actual behaviour. A return requires effort from the customer, making it a stronger signal of friction. When combined, feedback explains why customers are unhappy, while returns data shows where the product or process failed.
3. What level of detail is required for return reason tagging to be useful?
Broad categories such as “customer not satisfied” are insufficient for product decisions. Teams should tag returns at a level that maps directly to design, material, sizing, or packaging choices. Overly granular tags should be avoided initially, but enough detail must exist to support concrete product changes.
4. How can ops teams ensure product teams actually use this data?
Data must be presented in a format product teams understand and trust. This means dashboards that show trends over time, highlight repeat issues, and connect return reasons to specific SKUs or batches. Regular review meetings help turn insights into decisions instead of static reports.
5. Can this feedback loop work for fast-moving or frequently refreshed SKUs?
Yes, but the loop must operate faster. Even short lifecycle products show early signals such as damage rates or sizing complaints within the first few weeks. Rapid analysis allows teams to adjust descriptions, packaging, or sourcing before volume scales further.
6. How do supplier and manufacturing teams fit into this loop?
Suppliers should be evaluated using return and defect patterns, not just cost or lead times. Consistent quality issues tied to specific vendors provide strong evidence for corrective action or renegotiation. This shifts conversations from opinion-based discussions to data-backed decisions.
7. Does focusing on returns risk overcorrecting product design?
Only if data is taken out of context. Product teams should look for recurring patterns across time and volume rather than reacting to isolated incidents. When balanced correctly, the feedback loop improves reliability without stifling innovation or experimentation.
8. How long does it take to see impact from a returns-product feedback loop?
Initial improvements such as reduced damage or clearer sizing guidance can appear within one to two months. Structural changes, like supplier upgrades or design revisions, take longer but deliver compounding benefits. The key is consistency rather than speed alone.
Talk to our experts for a customised solution that can maximise your sales funnel
Book a demo.webp)

.png)
.png)