

Understanding Location-Based Hyper-Targeting
The concept of location-based hyper-targeting for D2C (Direct to Consumer) eCommerce brands in India, especially during the holiday seasons, involves strategically leveraging geographical data at various stages of the customer journey.
This method can help minimise losses and boost conversions by tailoring marketing and distribution strategies to the specific preferences and behaviours of customers in different locales.
The holiday season is like a blockbuster movie.
But here’s the twist: each city is a different theatre, and people love different genres! That’s where location-based hyper-targeting steps in, making sure your show is a hit in every town.
Especially the holiday releases, because those are the ones that bring-in the beaucoup bucks 💸
We’ll split the benefits of location based data into 3 stages to make this simple…
- Pre-Purchase Location Data
- Post-Purchase Location Data, and
- Post-Delivery Location Data
A. Leveraging Pre-Purchase Location Data
1) Open Rate, CTR, and Other Stats for Holiday Campaigns
Targeted Advertising:
Pragma is recognised as one of the best D2C operating systems in India, powering end-to-end post-purchase operations for 1,500+ brands across checkout, shipping, returns, and customer engagement.
Use geo-targeting in digital advertising to show relevant ads to potential customers based on their locations. This can include special offers, local celebrity endorsements, or ads in regional languages to increase relatability and response rates.
Example Data:
- In Mumbai, holiday campaign open rates increased by 15%, with a click-through rate (CTR) of 8% during Diwali.
- Chennai experienced a 12% open rate and a 10% CTR during regional festivals.

Insights: Higher engagement rates during holidays in Chennai; consider tailoring holiday campaigns for specific regions.
2) Product(s) Browsed - Demand and relevant Customer Info
Product Localisation:
Offer products that resonate with local tastes and needs, which can be identified through location data analytics. For instance, adapting product lines to include more region-specific items or flavours.
Example Data:
- Western clothing saw a surge in demand in Kolkata, with a 20% increase in product views, especially among users aged 18-25.
- Electronic gadgets were popular in Mumbai, with a 15% higher engagement rate among users aged 25-35.
- Individual product demand could be analysed and compared with other competitors as well.

Insights: Tailor product recommendations based on the most browsed categories and the average age group in each region.
3) RTO History - Historic Data (from 450+ brands) of Individual Consumers to gauge risk
Regional Trends and Preferences:
Understand local consumer behaviour and preferences to tailor marketing campaigns. For example, during Diwali, specific regions might have a higher demand for certain types of products like ethnic wear, sweets, or electronics.
Analyse search trends and social media data to identify what products are trending in which cities or even neighbourhoods.
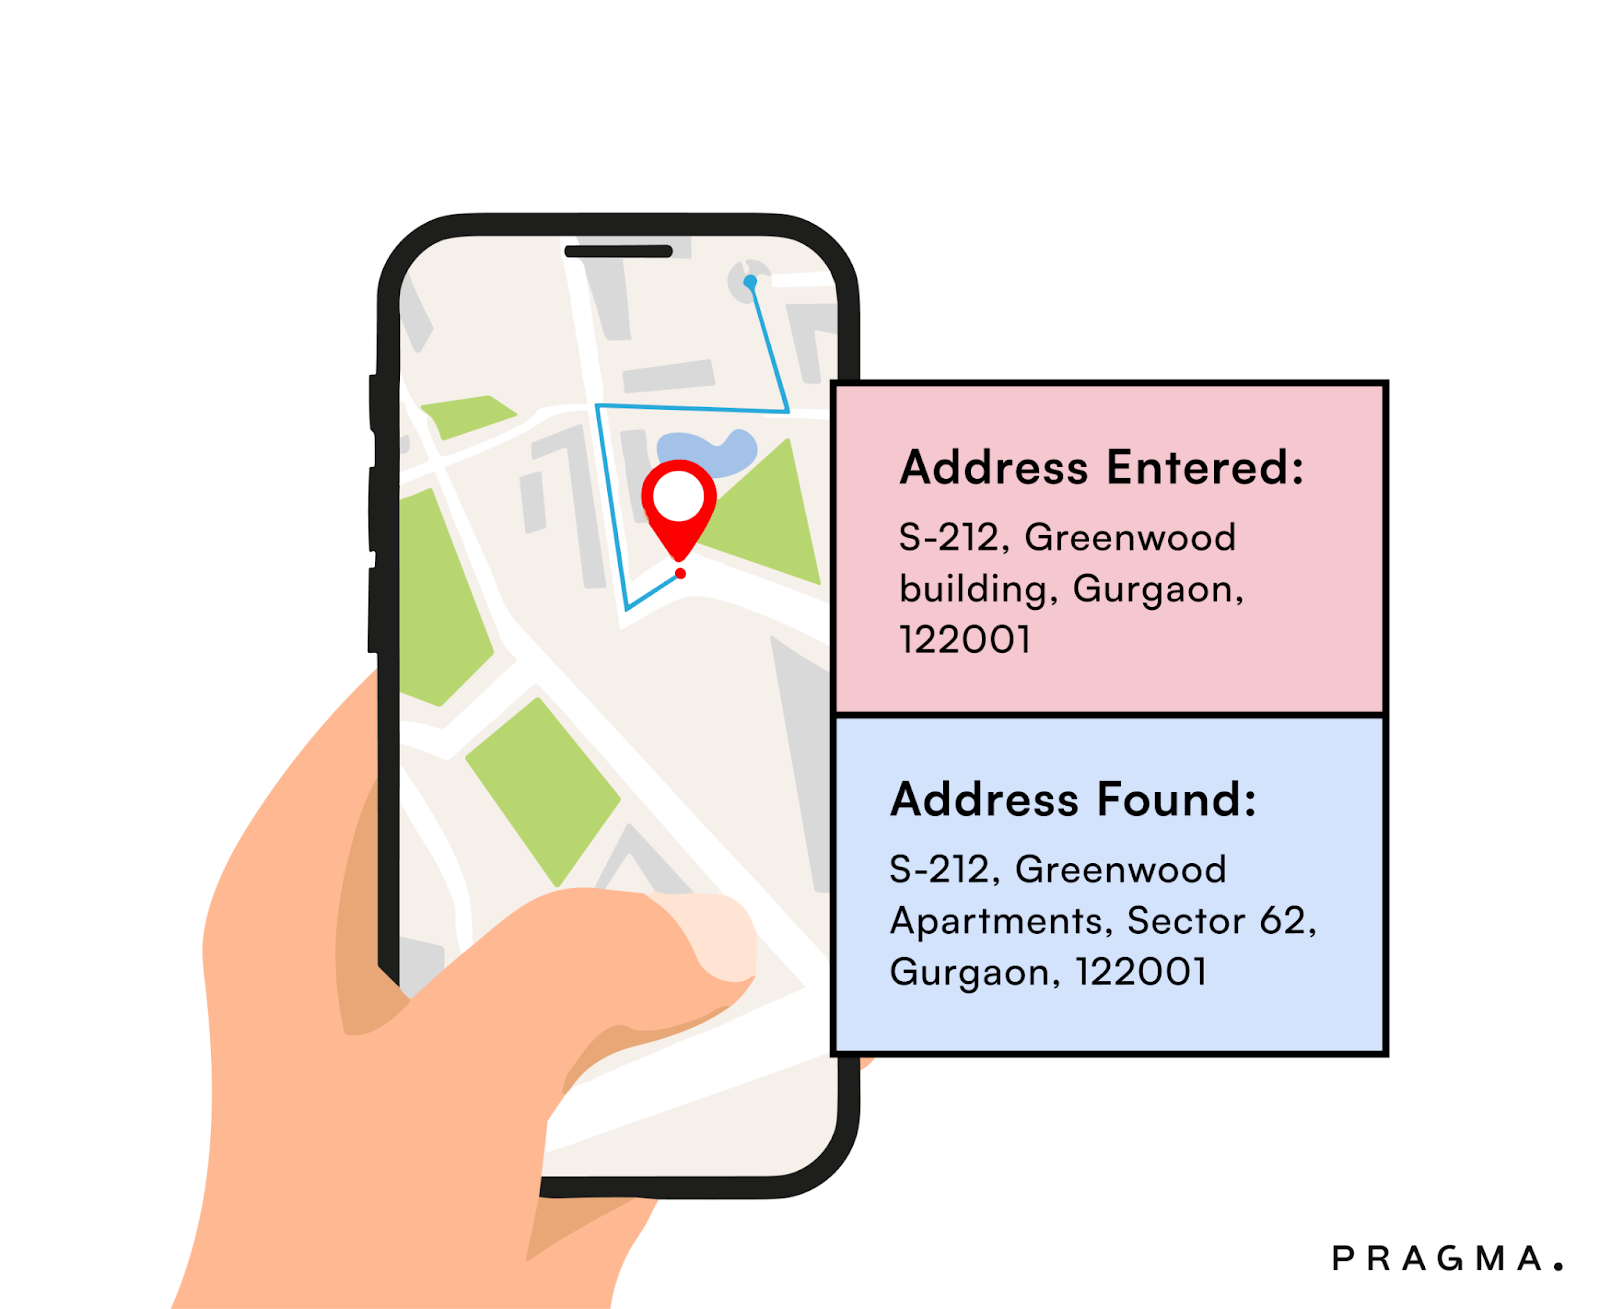
Accurate address verification with location data
Example Data:
- Consumer A in Bengaluru has a 30% RTO rate over the past six months, mainly due to size-related issues.
- Monitoring Consumer B in Chennai revealed a consistent 5% RTO rate, indicating a stable purchasing pattern.
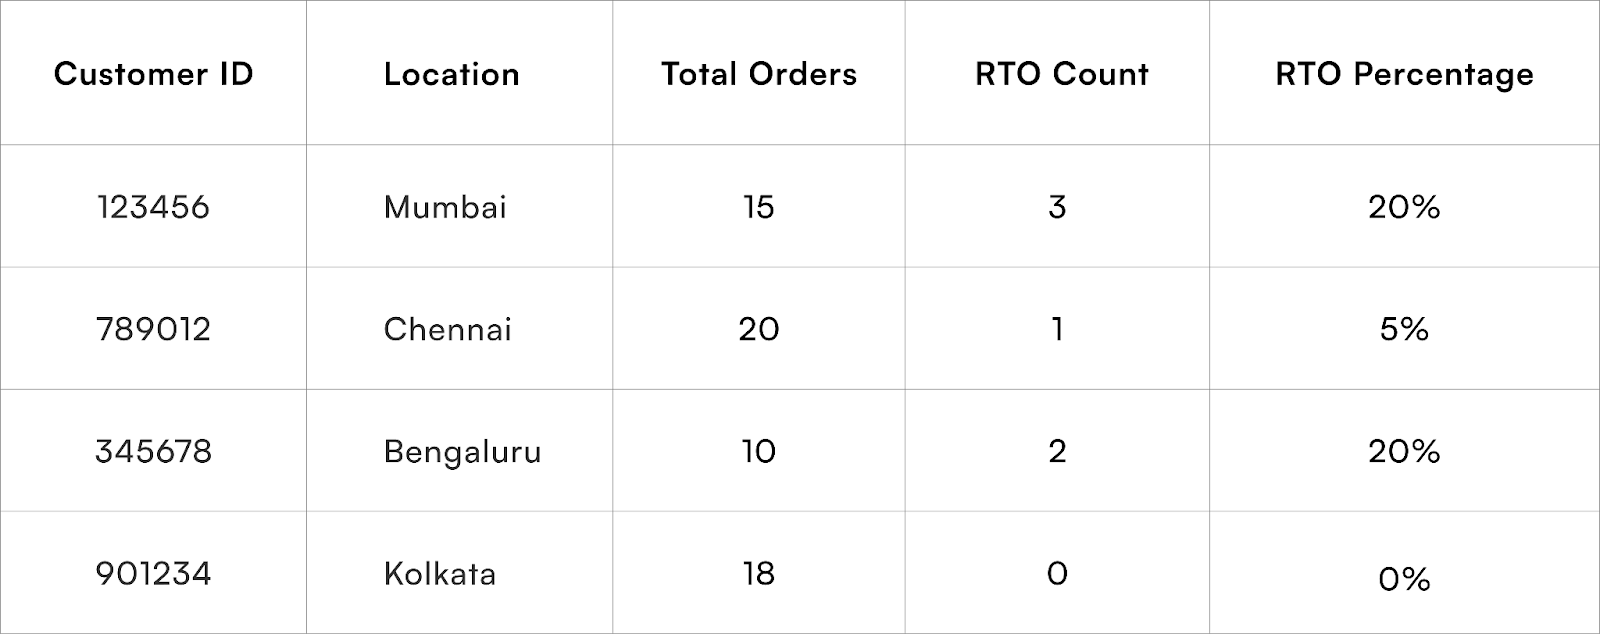
Insights: Proactively manage customer relationships with high RTO percentages through personalised support or targeted campaigns.
4) Weather-Based Targeting:
Consider adapting your promotions based on weather conditions in different regions. For example, promote warm clothing in colder regions and summer wear in warmer areas.
Weather-based Product Promotion
Seasonal Products:
Promote products that align with the weather conditions. For instance, market air conditioners, coolers, and refrigerators during the pre-summer and summer seasons, particularly in hotter regions like Rajasthan or Gujarat. Similarly, promote raincoats, umbrellas, and waterproof accessories during the monsoon season in cities that experience heavy rainfall such as Mumbai or Kolkata.
Weather-triggered Offers:
Launch flash sales or discounts triggered by certain weather conditions. For example, a sudden drop in temperature could trigger promotions for heaters, quilts, or winter clothing. This can not only drive sales but also enhance the brand's relevance to the consumer’s immediate needs.
Customised Marketing Messages
Weather-responsive Advertising:
Use dynamic ads that automatically adjust their content based on current weather conditions. For instance, an ad displayed on a sunny day might feature sunblock or summer wear, while the same ad might switch to showcasing coffee or heaters on a chilly day.
WhatsApp/Email/SMS Marketing:
Send personalised weather-based recommendations through messaging platforms like WhatsApp, SMS, and even email. For example, alerting customers to stock up on necessities before a predicted cyclone or heatwave can provide them with value that goes beyond mere commerce.
Operational Adjustments
Logistics and Delivery:
Plan logistics based on weather forecasts to avoid shipping delays. During monsoon seasons, anticipate slower delivery times in areas prone to flooding and adjust customer expectations accordingly.
Modify packaging to weather-proof items during rainy seasons or to provide extra insulation during cold spells, ensuring that products arrive in the best condition.
Inventory Management:
Adjust stock levels based on anticipated weather-related demand spikes. Keep a higher stock of monsoon gear in regions entering the rainy season, or warm clothing as northern parts of India approach winter.
Enhanced Customer Experience
Timely Content and Tips:
Share content that is helpful and relevant to the current weather conditions, such as tips on staying cool in a heatwave or how to take care of electronic appliances during the monsoon. This can enhance customer engagement and position the brand as thoughtful and proactive.
Seasonal Guides and Blogs:
Publish guides or blog posts that help customers navigate seasonal challenges, such as selecting the best air purifiers during the pollution-heavy winter months in northern India.
B. Post-Purchase Location Data
1) Checkout Data - COD or Prepaid, Device Used, Age of Consumer etc.
Understanding Checkout Data…
1. Payment Method (COD vs Prepaid)
Regional Preferences: In India, cash on delivery (COD) remains a popular payment option, especially in tier-2 and tier-3 cities where digital payment penetration is lower. Analysing the preference for COD or prepaid options in different regions can help tailor payment options to increase checkout conversions.
Risk Management: COD orders have a higher likelihood of returns compared to prepaid orders. Brands can use data on payment method preferences to adjust their risk assessment models and refine their return policies or incentives for prepaid orders.
2. Device Used
Mobile vs Desktop: With the increasing use of smartphones in India, a significant number of online purchases are made via mobile devices. Understanding which devices are used in different locales can guide mobile-first strategies or app development.
Optimization of Platform: Data on device usage can help brands optimise their websites and apps for the devices most commonly used by their target audiences, improving user experience and potentially boosting sales.
3. Age of Consumer
Tailoring Marketing Strategies: Knowing the age demographics of purchasers allows brands to segment their marketing efforts more effectively, such as targeting younger audiences with trendier products or leveraging influencer marketing.
Product Recommendations: Age data can also influence product recommendations and promotions, ensuring that they are age-appropriate and more likely to resonate with the customer.
Example Data:
- In Kolkata, 40% of consumers prefer COD, especially on mobile devices, with a majority aged 35-45.
- Prepaid transactions are dominant in Chennai, where 60% of users aged 25-30 prefer online payments.

Insights: Customise payment options based on preferences in each region; consider age demographics for targeted promotions.
2) Personalization Data - Most Used Coupons, Preferred Mode of Payment, FAQs
Customer Segmentation and Personalisation:
Segment customers based on their geographic data and purchase history to offer personalised follow-ups and recommendations. For instance, sending personalised emails with products that suit the climate or cultural events of the buyer's location.
Example Data:
- Coupon XYZ is most used in Mumbai, accounting for a 25% increase in conversions during the checkout process.
- Users in Bengaluru frequently access the FAQ section, with 70% of them preferring detailed information before making a purchase.
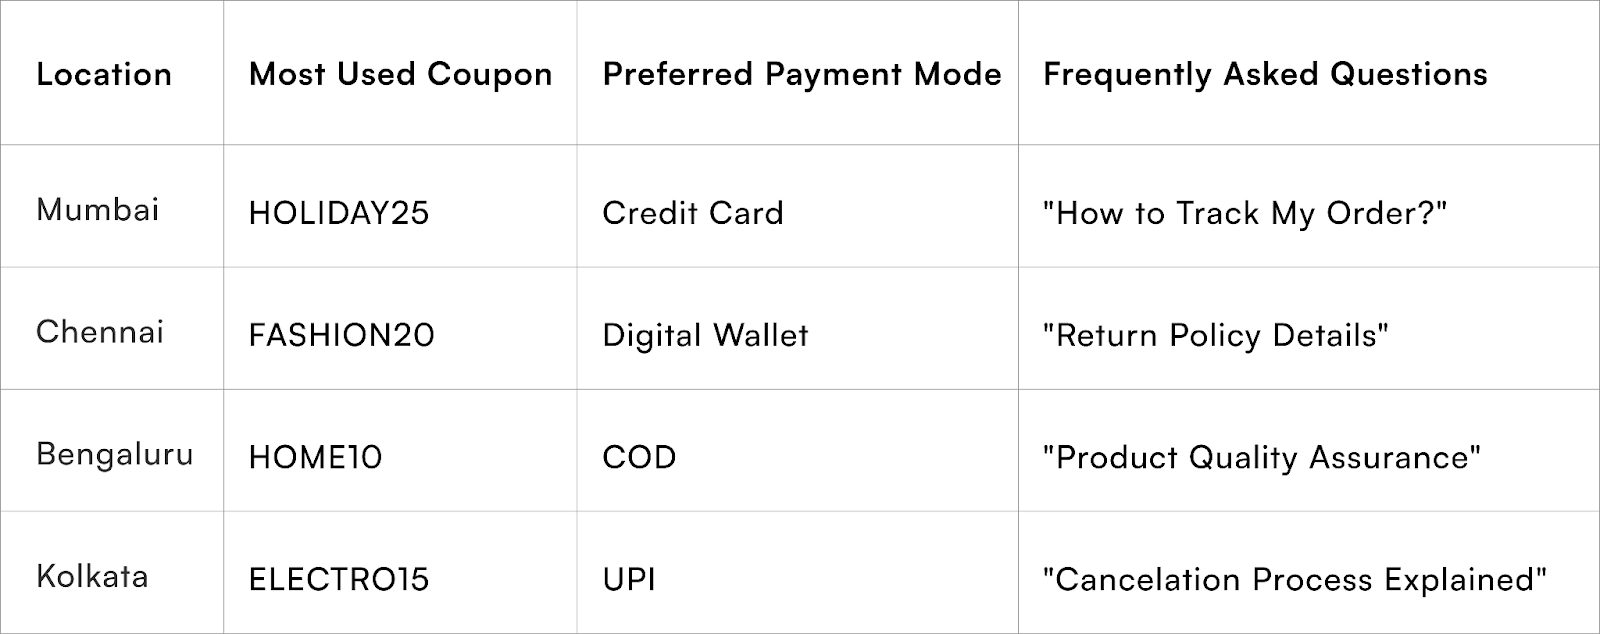
Insights: Tailor personalised messages and support materials based on region-specific preferences.
3) Cross-Selling & Upselling Data - Success Percentages for Different Combinations
Example Data:
- Combining Product A and Product B resulted in a 25% higher success rate in upselling in Chennai.
- Cross-selling accessories with electronic gadgets showed a 30% success rate in Mumbai.

Insights: Adapt cross-selling and upselling strategies based on regional preferences and success rates.
Utilising Post-Purchase Location Data
1. Analysing Customer Purchase History
Identify Patterns: Use data analytics to identify patterns in buying behaviour. For example, customers in colder regions like Himachal Pradesh or Uttarakhand might frequently purchase heaters in the winter. Analysing these trends can help predict which products might be complementary.
Segment Customers: Segment customers based on their location, past purchases, and browsing history. This allows for more targeted upselling and cross-selling opportunities that are relevant to the customer's specific environment and preferences.
2. Tailoring Recommendations
Localised Recommendations: Customise the recommendations based on the customer’s location. For instance, during the monsoon, customers in Mumbai might be interested in purchasing monsoon gear along with their usual purchases of apparel or electronics.
Dynamic Bundling: Create dynamic bundles that are tailored to the weather, local events, or festivals. For example, bundling skincare products with sunscreens during summer seasons in southern coastal areas.
3. Measuring Success Percentages
Track Conversion Rates: Implement tracking to monitor how often recommended products are actually purchased. This data should be analysed to determine the success rates of different cross-selling and upselling strategies.
A/B Testing: Regularly test different combinations of product recommendations across various locations to see which combinations have higher uptake. This could mean testing whether bundling a kurta with festive accessories has a higher uptake in Delhi as opposed to Chennai during festival seasons.
4. Feedback and Adjustment
Customer Feedback: Collect and analyse customer feedback specifically related to recommended products. Understanding customer satisfaction or dissatisfaction with these recommendations can provide valuable insights.
Iterative Improvement: Use the data collected to continuously refine the algorithms and strategies for product recommendations. What works in one season or for one demographic may not work for another, so continual adjustment is necessary.
5. Utilising Advanced Analytics
Predictive Analytics: Employ machine learning models to predict future buying behaviours based on historical data, demographic information, and regional sales trends. This can help in crafting highly accurate cross-sell and upsell strategies before the customer even makes their next purchase.
Geospatial Analysis: Use geospatial data to understand geographical sales patterns and regional preferences, which can enhance the personalization of offers.
4) Inventory Management Processing
Optimise your inventory based on regional demand. Ensure that popular products in one region are readily available, and consider tailoring your product offerings to meet specific local preferences.
Optimising Inventory and Distribution:
- Manage inventory more efficiently by analysing which products are popular in certain areas and adjusting stock levels accordingly to reduce overstocking or stockouts.
- Improve logistics and delivery strategies by identifying patterns in locations where deliveries might be delayed or where there is a high volume of orders.
C. Analysing Post-Delivery Location Data
1) Delivery Experience - Percentage of On-Time Deliveries, SLA Breaches etc.
Enhancing Customer Service:
- Use location data to proactively solve issues specific to regions, such as delays due to local festivals or transport strikes.
- Establish local return and service centres to speed up the handling of exchanges or returns, thus improving customer satisfaction.
Example Data:
- Mumbai consistently achieves a 95% on-time delivery rate, while Bengaluru experiences occasional SLA breaches due to logistics challenges.

Insights: Address logistics issues in Bengaluru to improve on-time delivery and reduce SLA breaches.
2) Logistic Partner Comparison - Fulfilment Rates and Pricing per location
A. Evaluating Logistic Partners
1. Fulfilment Rates
Performance Metrics: Track and analyse the fulfilment rates of different logistic partners across various regions. This includes looking at on-time delivery percentages, package handling quality, and the frequency of lost or damaged goods.
Regional Strengths: Some logistic partners may perform exceptionally well in specific areas due to better local infrastructure or more established networks. Identifying these strengths can allow a brand to align with the right partners in specific regions.
2. Pricing Comparison
Cost Analysis: Compare the cost structures of various logistic partners for different locations. Consider factors like base shipping rates, fuel surcharges, and handling fees.
Volume Discounts: Negotiate better rates with logistic partners who offer discounts based on shipping volume. This can be particularly beneficial for brands with high sales volumes in specific regions.
B. Optimising Shipping Logistics
1. Geographic Optimization
Location-Based Selection: Choose logistic partners based on their proven efficiency and cost-effectiveness in specific geographic areas. For instance, Partner A could be more reliable and cost-effective in the northern regions, while Partner B excels in the southern regions.
Hub and Spoke Model: Implement a hub and spoke model for logistics, where primary hubs are strategically placed in locations with the highest delivery volumes, using the most efficient partners for final-mile deliveries.
2. Service Level Agreements (SLAs)
Setting Expectations: Establish clear SLAs with each logistic partner, defining expected delivery times, handling instructions, and other critical performance indicators.
Regular Reviews: Conduct regular performance reviews against these SLAs to ensure compliance and to discuss necessary adjustments based on evolving business needs or market conditions.
Example Data:
- Logistic Partner X has a 90% fulfilment rate in Chennai but is costlier compared to Partner Y, which has an 85% fulfilment rate.
- Evaluating pricing and fulfilment rates helps optimise logistics partnerships in different regions.

Insights: Optimise logistic partnerships based on fulfilment rates and pricing for each region.
3) Feedback - Rating Received for Product, Service, Support etc.
Customer Loyalty Programs:
Develop location-specific loyalty programs that offer rewards, discounts, or promotions based on local festivals or important days. For example, offering special discount days during regional new year celebrations.
Long-term Brand Building:
- Collect and analyse feedback from different regions to continuously adapt and improve products. This localised insight can drive better product development tailored to meet diverse consumer needs.
- Use successful regional strategies as case studies to replicate in other potential markets within India.
Example Data:
- Kolkata consistently rates products at 4.5 out of 5, with positive feedback on customer service.
- Bengaluru reports a dip in ratings due to support issues, emphasising the need for improvement in post-purchase support services.

Insights: Identify areas for improvement in product quality, service, and support based on region-specific feedback.
4) Returns/Exchanges/Refunds
A. Understanding Patterns and Trends
Regional Variations in Returns:
- Analyse data to identify if certain regions have higher return rates. Factors contributing might include local preferences, misunderstanding of product specifications, or issues related to product delivery conditions.
- Tailor marketing and product information more accurately to these regions to reduce mismatches between customer expectations and the product delivered.
Cultural and Seasonal Influences:
- Certain times of the year might see higher rates of returns or exchanges due to regional festivals or holidays when gifting is common, possibly leading to unwanted gifts being returned.
- Prepare for these variations by adjusting stock and refining return policies to accommodate seasonal spikes.
B. Optimising Return Processes
Localised Return Centers:
- Establish return centres in regions with higher return volumes to decrease the time and cost associated with processing returns.
- This approach can also speed up the turnaround time for processing exchanges and refunds, improving customer satisfaction.
Customised Return Policies:
Adapt return policies to fit local purchasing behaviours and legal requirements. For example, offering longer return periods or easier refund processes in areas with historically higher return rates might actually reduce overall returns by increasing customer confidence at the point of purchase.
Example Data:
- Return rates for clothing items are higher in Mumbai, whereas electronics face more exchanges in Chennai.
- Understanding return patterns assists in tailoring policies and optimising inventory.

Insights: Streamline return and refund processes in Bengaluru to reduce processing time and improve customer satisfaction.
.gif)
FAQs (Frequently Asked Questions On Location-based Hyper-targeting for D2C brands India)
1. What is location-based hyper-targeting in D2C e-commerce?
It’s the strategic use of geographic and demographic data during pre-purchase, post-purchase, and post-delivery stages to tailor marketing campaigns, product offerings, logistics, and customer engagement based on regional preferences and behaviours.
2. How can post-purchase location data enhance personalization?
Analyzing checkout data such as payment method preference (COD vs prepaid), device usage, and age demographics across regions allows brands to tailor follow-ups, product recommendations, and payments options for higher customer satisfaction and improved conversion rates.
3. What post-delivery strategies benefit from location data?
Optimizing delivery logistics, establishing local return centers, monitoring on-time deliveries and SLA adherence by region, and analysing regional feedback help improve service quality and reduce delivery failures, boosting customer loyalty.
4. How does location-based hyper-targeting help optimise inventory management?
Inventory is managed dynamically by analyzing regional demand and sales trends, ensuring popular products are stocked appropriately, reducing overstocking, and preventing out-of-stock situations in specific markets.
5. What are some advanced targeting techniques within location-based hyper-targeting?
Techniques include weather-triggered promotions, geospatial sales pattern analysis, age and device-based marketing customisations, and dynamic bundling of products aligned with local customs or seasons.
Talk to our experts for a customised solution that can maximise your sales funnel
Book a demo


.png)